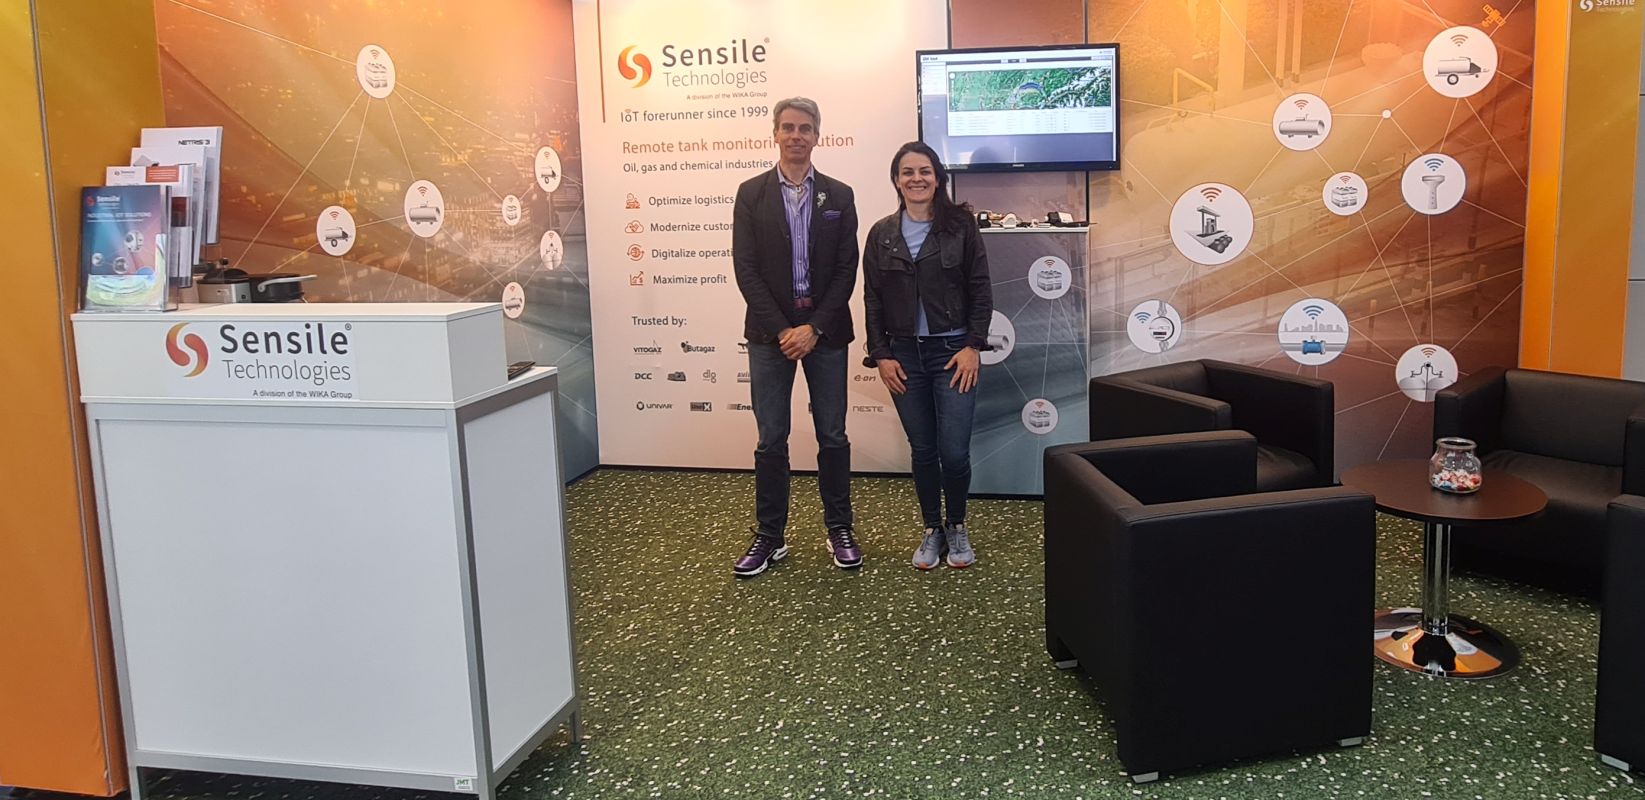
Focus on expansion at UNITI Expo 2024
From 14 to 16 May 2024, we were delighted to welcome many visitors to our stand…
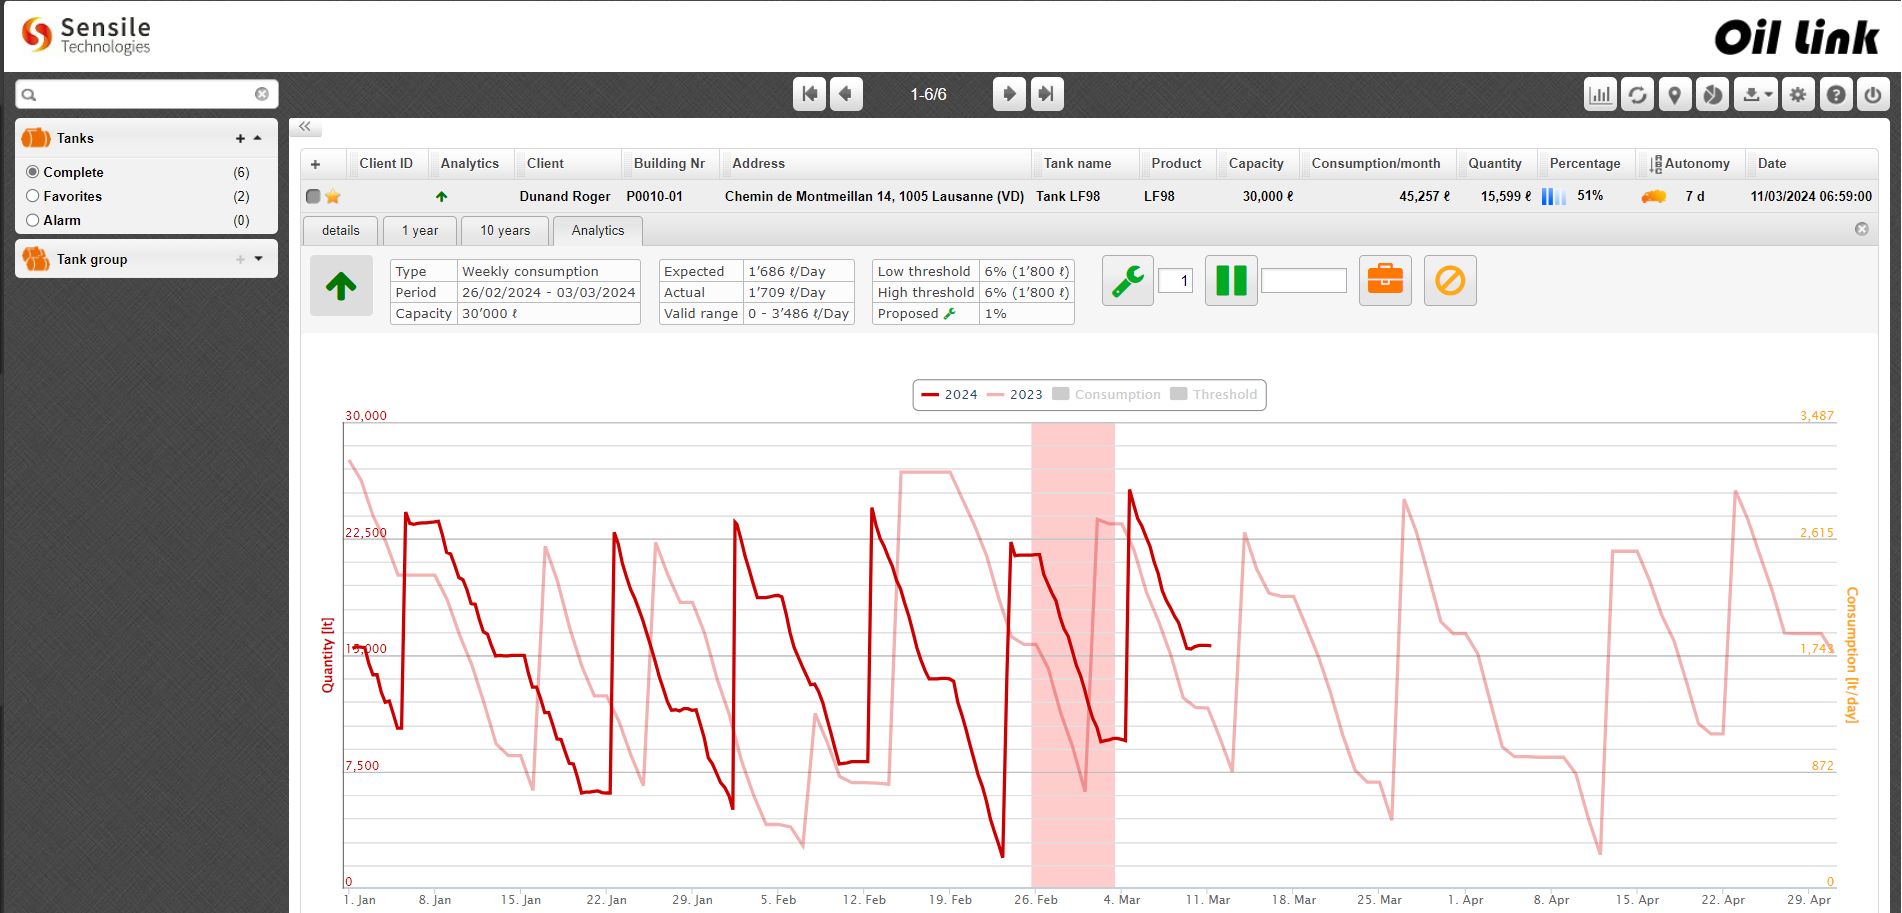
Make the most of consumption data to improve your operations and processes
By remotely monitoring oil, gas and chemical tanks, you can collect vast…

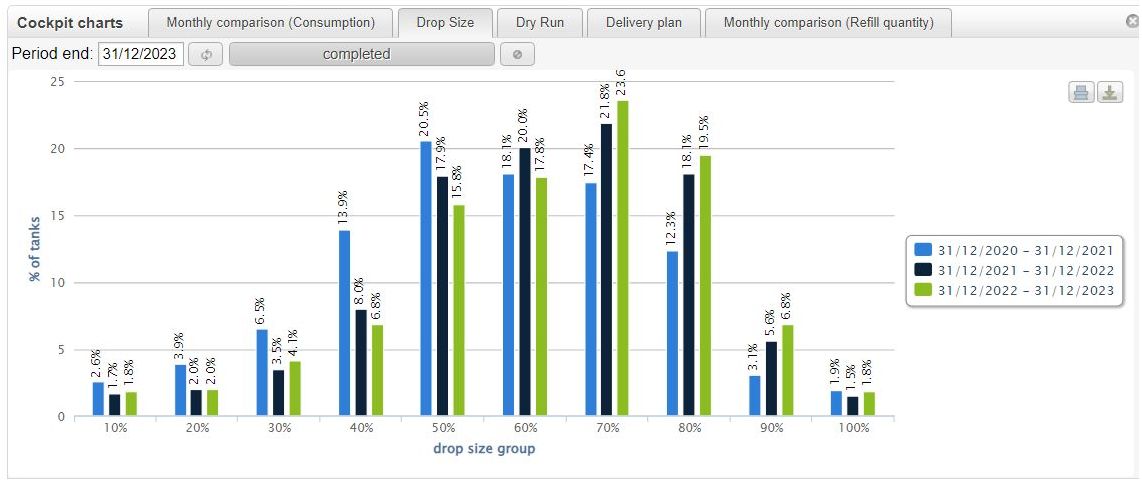
Indicators to monitor and improve your distribution performance
Wondering how to reduce the cost of delivering your oil, gas or chemical…